In all the excitement of securing partnerships with compelling influencers and executing a unique campaign, it can be easy to forget about the nuts and bolts of your latest influencer marketing activation: The results. Influencer marketing reporting requires a range of metrics, not all of which will be immediately available to you from your partners or the native platform you’re advertising on.
To give you a clearer picture of what metrics you should be trying to find and how best to obtain them, we’re going to look over some of the best practices for tracking and reporting your influencer marketing campaigns on live streaming. The examples below are highly generalized, so you can apply them to anything from game launches to esports events to sponsored shoutouts. We’ll also showcase the value of using Stream Hatchet and Sideqik’s dedicated dashboards to visualize and compile data for ease of reporting at the end of your campaign.
Reporting Influencer Marketing Campaign Viewership with Key Metrics
Your key live-streaming stats will form the foundation of your tracking and reporting for any influencer marketing campaign. These are the same stats you would have used when originally finding influencer partners, so you can now compare the result of your activation with one of their typical (similar) streams. For example, compare the result of your sponsored marathon stream with one of your influencer’s previous marathon streams. We won’t go over all of these live-streaming stats here since we’ve covered that elsewhere, but here’s a reminder of some of the simplest stats we have:
- Hours Watched: The total time viewers spent watching a stream / many streams combined
- Average Minute Audience (AMA): The average number of viewers per minute over the specified time period
- Peak Viewership: The combined peak concurrent viewers across multiple platforms or streams
- Airtime: Total duration of a stream / many streams combined
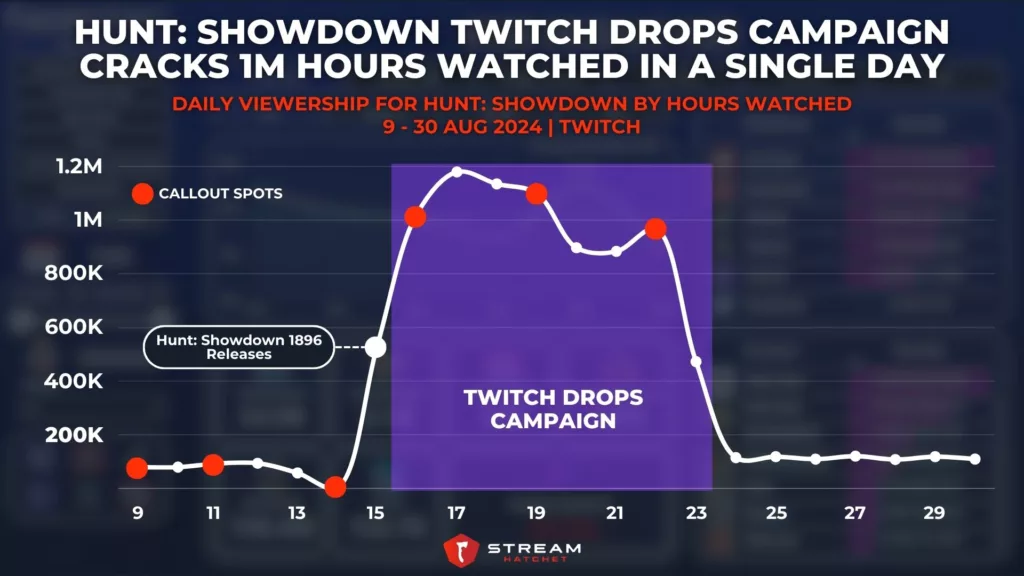
You can track each of these key stats over time to see how they align with notable moments in your activation. A classic example would be an esports tournament, where you can correlate peak viewership with the most hyped moment of the entire event (typically the grand final, or a planned appearance by a special guest). Alternatively, as shown in the graphic above, you can see how viewers respond to your social media callouts. For Hunt: Showdown 1896’s Twitch Drops campaign, reminding the fanbase of the week-long event typically led to a new wave of interest in streams on the same day.
Using Chat Engagement and Sentiment to Gauge Campaign Reception
Simple metrics will only take you so far, however: If you really want to understand how an audience is responding to your campaign, you need to see what they’re saying. Live-streaming activations are perfect for this, since live chats give instant access to a play-by-play commentary from the streamer’s fanbase. Seeing how many messages were sent or how many unique viewers were chatting on a stream tells you that people weren’t just passively watching: They were actively engaging with the stream.

We can go further though by performing a sentiment analysis. A broad sentiment analysis will tell you the ratio of positive:negative messages on a given stream, which works great as a litmus test for the overall opinion of the influencer’s cohort (as seen with the above analysis of people’s reception to Final Fantasy XIV’s upcoming mobile port). But for an influencer marketing activation, you should go further: Actually get in deep on chat logs and read what people are saying, then pull out model examples of common sentiments among them (both positive and negative). In the case of a game launch, you can combine this sentiment with reviews on the Steam Store page to get a clearer image of how players are reacting to your game.
Evaluating the Reach of an Influencer Marketing Campaign via Social Media
Campaigns have a flow-on effect, leading to buzz on other platforms as viewers report their reactions. Social media reach is particularly crucial for creative influencer marketing campaigns, since they’re designed to ignite the audience’s imagination and get people talking. In other words, tracking social media’s response to your campaign is essential for understanding the amplification of the campaign through earned media, not just paid media promoting the campaign.
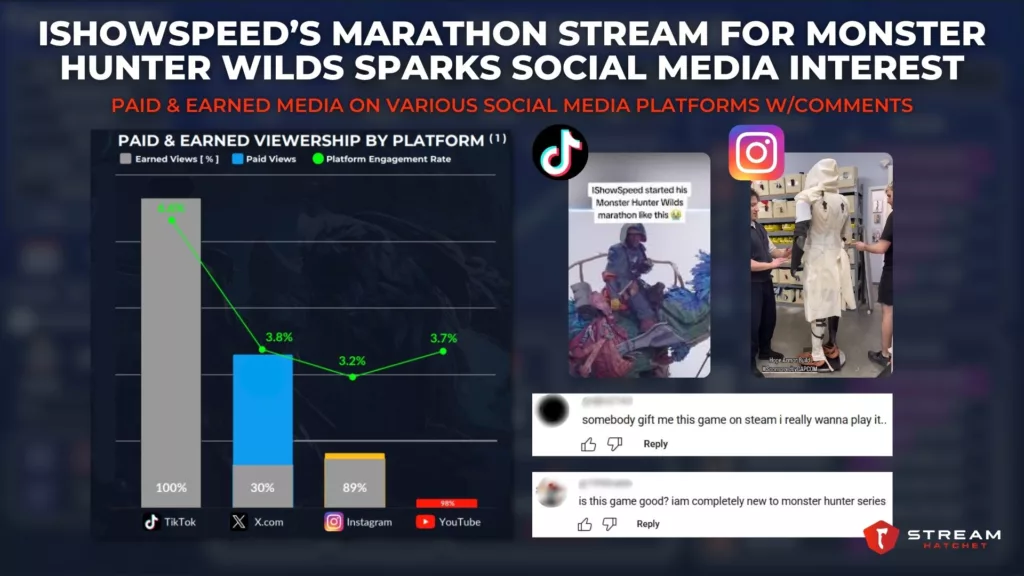
In the example above, you can see the impact of earned media compared to paid media. For Capcom’s activation for Monster Hunter Wilds, IShowSpeed’s marathon stream created massive amounts of earned social media attention on TikTok despite no paid media on the platform. Aside from paid and earned media numbers, campaign managers should also scan through comments on other social media platforms in a similar manner to how they pulled comments from live-stream chat. Because audiences differ vastly between platforms, its worth separating these responses by platform to see how the activation was received among different demographics.
Visualizing and Compiling Your Influencer Marketing Reporting
Key metrics, chat engagement, and social media reach can all be combined in one place to make diving through data simpler. The primary way to handle this is with a campaign management dashboard. These dashboards are live so you can track your ongoing influencer marketing campaign, with a focus on making the numbers as simple to understand as possible. Ongoing results are more important for longer campaigns like Twitch Drops or multi-week esports tournaments, where you can react to the data to address problem areas (e.g. making callouts on social media, or troubleshooting issues with chat functionality).
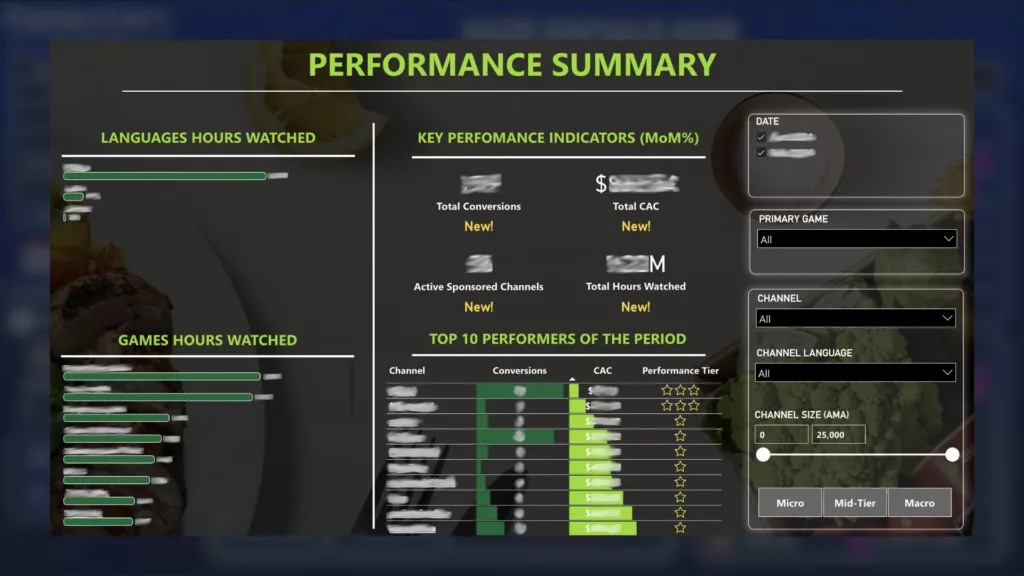
Once the campaign is over, you can then pore back over the data (if you want to analyze specific timestamps) and convert the final results into a more presentable report format for external readers. Stream Hatchet and Sideqik’s dashboards (like the one shown above) cover all of these functions, while also pairing you with an expert who can “drive” the dashboard if needed. Even better, our dashboards are custom-made following discussions with the brand’s campaign manager to ensure they’re in a format that they find intuitive, and that contains all of the functionality they require (e.g. links to Shopify store metrics).
_
Tracking and reporting isn’t just about measuring the success of a single influencer marketing campaign. These results should be carried into the next activation as well, either being used to troubleshoot problem areas (e.g. rushed planning, failed management) or to optimize and scale aspects of the campaign that worked well (e.g. social platforms with high traction, events with higher conversion rates). We’ll be covering optimization and scaling in more detail in our upcoming Influencer Marketing Guide.
To find out when Stream Hatchet and Sideqik’s Influencer Marketing eBook drops, follow the Stream Hatchet newsletter:
